
Retail layout optimization is the practice of arranging a store's entrance, aisles, fixtures, and displays around measured shopper behavior instead of intuition. It pays: according to McKinsey & Company, optimizing store layouts can boost sales by up to 15%. Layout decides how customers move through the store, which products they see, and how long they stay. With people counting and flow analytics in the mix, retailers can test every layout change against real movement data and keep what works. Here are the seven rules that turn layout from a design opinion into a measurable system.
What is retail layout optimization?
Retail layout optimization means using zone-level visitor data (entries, walking paths, dwell time, and conversion) to decide where products, fixtures, and staff belong on the sales floor. Instead of redesigning on instinct, the retailer measures how shoppers actually move, changes one variable, and measures again. The goal is more revenue per square meter from the same floor space, without rebuilding the store.
Why store layout decides sales
A well-planned layout keeps customers in the store longer, puts more products in front of them, and quietly directs the route they take. Aisles, shelves, and displays work together as a path, and that path decides what gets seen. Layout affects everything from customer flow to operational efficiency. And most importantly, sales.
The core objectives are space efficiency and sales per square foot. Strategic product arrangement highlights high-margin items, promotes seasonal goods, and encourages impulse purchases. An optimized layout also simplifies restocking and staffing, so the gains show up on both sides of the margin.
7 data-driven rules for retail layout optimization
1. Measure the current flow before moving anything
Every layout project starts with a baseline. People counting at the entrances and flow analytics inside the store show where shoppers actually walk, where they stop, and which zones they never reach. Without that baseline there is no way to prove a change worked. Record at least two full weeks, including weekends, so day-of-week patterns do not distort the picture.
2. Design the entrance around the decompression zone
The first meters inside the door are a decompression zone: shoppers entering from the street are still adjusting and miss most of what is placed there. Keep that zone open, and put the first real merchandising statement just beyond it, where shoppers have slowed down enough to look.
3. Find dead zones with heatmap data
A store heatmap shows which zones shoppers never reach. Dead zones are rarely fixed by signage alone; they usually need a destination category, a clear sight line, or a route change that pulls traffic past them. After the change, the same heatmap shows whether the zone came back to life.
4. Give high-margin products the proven high-traffic zones
Position high-margin items and promotional displays in the zones the data shows attract the most visitors, not the zones the planogram assumed would. Movement paths also reveal cross-merchandising pairs: products that share a route belong within reach of each other, which lifts basket size without adding floor space.
5. Let your own sales data set the product mix
Layout should follow what the store's own numbers say about its shoppers. Category sales, basket composition, and visit patterns from the retailer's POS and loyalty systems show which assortments deserve more space and where. That is customer understanding built from data the retailer already owns; it requires no profiling of individual shoppers on the floor.
6. Keep the layout on brand
A layout that converts but contradicts the brand costs more than it earns. Flow data shows how customers interact with each area of the store, so brand-defining spaces (a flagship display, a service counter, a fitting lounge) can be positioned where they are actually seen, not just where the concept sketch put them.
7. Re-measure after every change
Layout optimization is a loop, not a project. After each move, compare the same zone's traffic, dwell time, and conversion before and after. Real-time dashboards make this a weekly habit rather than an annual redesign, and they catch regressions early, for example when a relocated category quietly starves a neighboring one.
How Ariadne measures what a layout actually does
Ariadne gives retailers zone-level visitor flow: entries, paths, dwell time, and repeat-visit patterns, in real time. Ariadne measures this with Hybrid Fusion, its patented camera-free method. Time-of-Flight depth sensing counts every visitor at the entrances, capturing geometry rather than images, while patented phone signal sensing follows movement through the interior, detecting the signals a phone emits even in airplane mode, and tracks that movement to about one-metre precision. The sensor streams both feeds to Ariadne, where Hybrid Fusion combines them into one trajectory per visit and computes counts, dwell, and paths. The streams carry no identifier: no MAC address, no device ID, no biometric data, and no camera is involved. Identifiers are stored only when a visitor explicitly opts in, which keeps the method GDPR-friendly and outside biometric territory.

- Real-time analytics: peak shopping times, so staffing and inventory follow the flow.
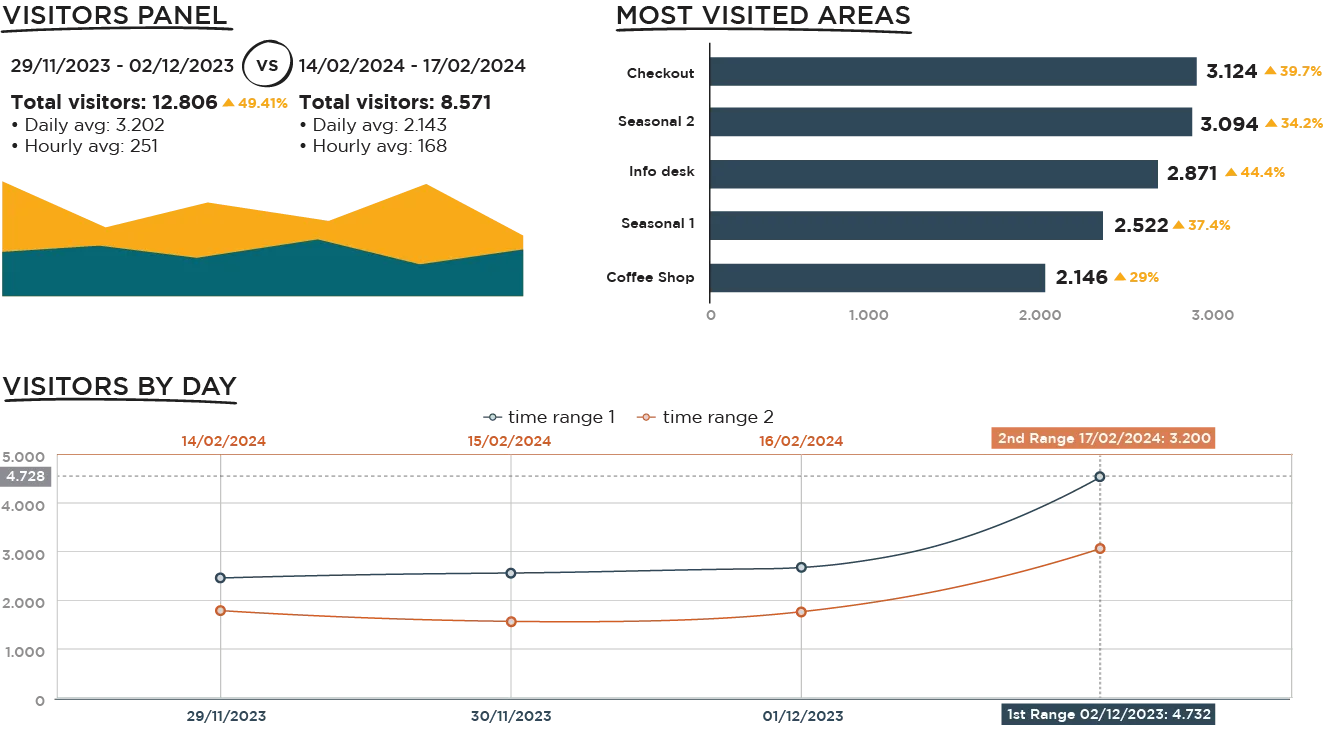
- Heat mapping: high-traffic areas for high-margin product and promotional placement.
- Performance metrics: KPIs for customer engagement, dwell time, and conversion rates.
- Customizable reports: actionable insights tailored to a specific store's questions.
What it looks like in practice
In WEKO's store, product placements optimized on heat map data led to a 30% increase in customer engagement. A well-known furniture retailer from Sweden used the same flow insights to redesign a showroom layout and saw a 25% increase in sales in high-traffic areas within three months. Both cases followed the loop above: baseline, change, re-measure.
Where retail layout optimization is heading
Predictive analytics is starting to close the loop automatically: models trained on historical flow and sales data can propose placements and flag zones likely to underperform before a season starts. The measurement layer stays the same; what changes is how fast a retailer can act on it.
The direction of travel is continuous improvement. Real-time flow data turns layout from a periodic redesign into a weekly operating decision, the same way e-commerce teams treat their homepage. Retailers who build that habit compound small gains: a fixed dead zone here, a better cross-merchandising pair there, each verified by the numbers.
Start with a baseline, apply the seven rules, and let the data arbitrate. To see zone-level flow data from your own floor, book a demo.


